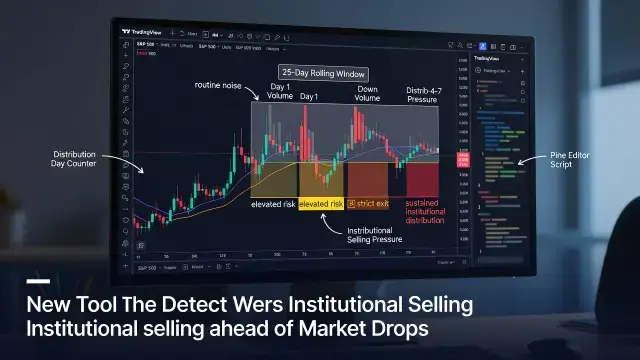
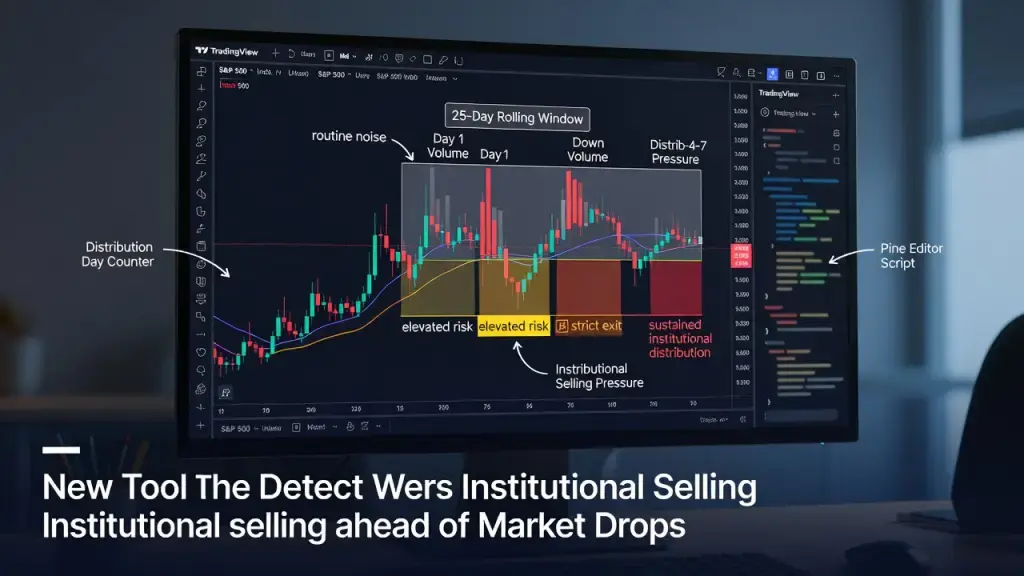
A newly circulated Pine Script indicator for TradingView applies a decades-old Investor's Business Daily concept - the distribution day - to modern charting software, giving traders an automated way to track institutional selling pressure. The tool counts down-volume sessions within a rolling 25-day window and flags when accumulated selling reaches levels historically associated with market tops or sharp corrections.
How Distribution Day Counting Works
The mechanics are straightforward, at least on the surface. Each time a stock or index closes lower than the prior session on higher volume than the day before, the indicator logs it as a distribution day. That's the textbook definition IBD popularized decades ago, and it still shows up in swing-trading and institutional research desks today. The script overlays a shaded grey zone directly on the price chart to mark the exact 25-session lookback period, so traders can see, in real time, which sessions are still being counted and which have aged out. Old signals roll off automatically - a count from 26 days ago no longer applies - which keeps the chart from turning into clutter.
Here's the part that matters for anyone actually trading off this signal: the count resets dynamically, not on a fixed calendar basis. That distinction changes how the warning escalates. A stock with four distribution days sitting quietly for weeks looks very different from one that racks up four in a single sprint.
Reading the Escalation Levels
The indicator color-codes risk in tiers, borrowing IBD's own language around institutional selling thresholds.
- Days 1-4 (gray): considered routine noise, not yet a meaningful signal.
- Day 5 (yellow): elevated risk - the tool flags caution if price can't quickly reclaim its key moving averages.
- Day 6 (orange): the strict exit threshold. If price hasn't recovered above all key simple moving averages by the sixth distribution day, the rule calls for exiting positions entirely.
- Day 7 and beyond (red): critical, signaling sustained institutional distribution and a higher probability of a severe correction.
That sixth-day rule is the backbone of the whole system. It's rigid by design - no discretionary override, no "just one more day to see." Rules-based exits like this exist precisely because traders talk themselves out of selling when the signal says sell. Whether that discipline actually improves outcomes depends entirely on execution, not on the indicator itself.
What the Tool Can and Can't Tell You
To put it plainly: this is a pattern-recognition aid, not a forecasting engine. It counts a specific type of price-volume behavior and applies a historical rule of thumb. It doesn't know why institutions are selling, doesn't account for sector rotation, and doesn't adjust for broader macro conditions. A distribution day during an earnings season sell-off reads identically to one during a genuine institutional exit, even though the underlying cause may be completely different.
Installation is simple enough - paste the script into TradingView's Pine Editor, save it, add it to the chart, and adjust the lookback length if needed. The low barrier to entry is part of the appeal and part of the risk. Any trader can apply a rigid six-day exit rule without understanding why the methodology works, when it fails, or how often distribution-day counts produce false signals in choppy, low-conviction markets.